Belridge Oil Field · San Joaquin Basin · CA

Composition is the first-order control on hardness — in every burial group.

Over 1,500 rebound-hardness1Rebound (Leeb) hardness, HLD — a non-destructive surface-hardness measurement made by firing a small impact body at the rock and measuring the rebound velocity. Reported as a unit-less Leeb number (HLD); higher = harder. Quick, repeatable, and sensitive to composition and porosity in mudrocks. measurements across four wells and 80 ft of core reveal clean silica-driven trends inside each diagenetic phase2Silica diagenesis — the stepwise transformation of biogenic opaline silica through burial: opal-A (amorphous) → opal-CT (cristobalite-tridymite) → quartz. Each step rearranges the silica fabric and changes porosity, density, and hardness. The mixed A-CT group is the transition zone between opal-A and opal-CT., plus a porosity story that inverts the textbook for siliceous mudrocks of the Monterey Formation.3The Monterey Formation is a uniquely siliceous Miocene marine unit of California, remarkable for its exceptional biogenic silica content, complex multi-stage diagenetic transformation (opal-A → opal-CT → microcrystalline quartz), and its dual role as California's dominant petroleum source rock and a major fractured-siliceous reservoir. Since Bramlette (1946): The Miocene Monterey Formation of California revisited — Behl, R. J. (1999).

R. W. Weller & R. J. Behl · CSULB · SPE-232849 (2026)
Explore the data Download CSV & PDF

Hardness vs. silica content, all burial groups

colored by silica phase
Live · from CSV
opal-A mixed A-CT opal-CT 6k′-quartz 12k′-quartz
Five conclusions from the manuscript

What we found.

Five concise findings — each anchored to a chart in the paper. Click any finding to jump to the matching preset in the data explorer below.

01Composition

Composition is the 1st-order control of rock hardness within any burial group4Burial group — a working subdivision of the siliceous-rock dataset by depth and silica phase: opal-A (shallow, amorphous), mixed A-CT, opal-CT, 6k′-quartz (~6,000 ft burial), and 12k′-quartz (~12,000 ft burial). Each group has been through a different burial and diagenetic history..

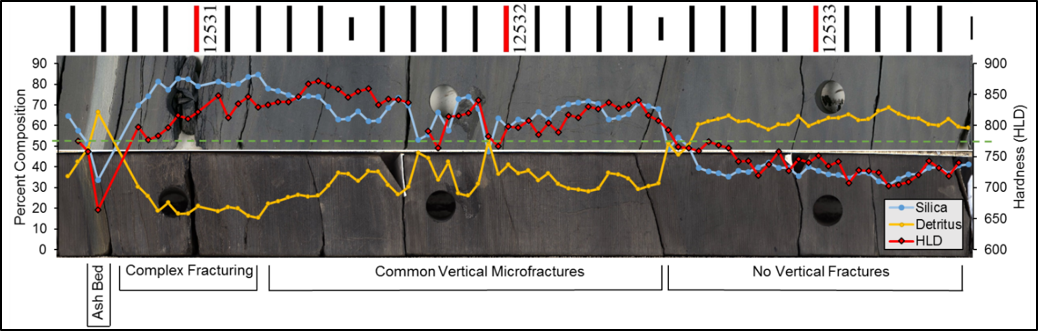
Argillaceous components have a strong negative correlation with hardness; diagenetic silica has a strong positive correlation. Hardness variability driven by composition inside a single burial group exceeds the variation between stages of silica diagenesis.

02Diagenetic steps

Hardening jumps most at opal-A → opal-CT (+47.3% HLD).

The opal-CT → quartz transition adds only +4.5% HLD in silica-rich rocks. In detritus-rich lithologies, that second transition gains more (+17.5% HLD) — driven by clay compaction and improved grain connectivity rather than silica phase change.

03Porosity inversion

Porosity is not a reliable indicator of hardness in siliceous mudrocks.

Across phases, hardness rises and porosity falls with silica diagenesis — the textbook trend. Inside each phase, porosity correlates negatively with detritus and therefore positively with hardness. This inverts the continuous porosity-strength relationship most studies report.

04Best fit · burial-resistant

Opal-CT shows the tightest composition-hardness fit and resists burial compaction.

Opal-CT has the best correlation between composition and hardness, and the steepest rate of change. Its rigid microcrystalline fabric also means hardness in opal-CT does not increase with depth — it resists mechanical alteration during burial.

05Deep-burial hardening

12k′-quartz rocks gain 25–30% HLD over 6k′-quartz without further phase change.

We propose clay diagenesis and early oil catagenesis accelerate burial compaction and hardening below ~10,000′. Silica cementation released by the illite-to-smectite transformation likely contributes to porosity reduction and the hardness increase.

Data explorer

Slice 1,546 hardness measurements any way you want.

Every toggle on the left filters the dataset in real time. The chart, the row count, the composition bar, and the downloadable CSV all update together. Quick-view presets above the chart serve as one-click starting points.

X
Y
Color
Quick views
Active filters:
Within-phase R² opal-A mixed A-CT opal-CT 6k′-quartz 12k′-quartz
1,546 of 1,546 measurements shown
Phase composition of current subset hover for count

Filtered rows · preview

first 20 of 1,546 rows · sortable on real build
WellDepth (ft)Phase Silica %Detritus % HLDPORhe % Quality